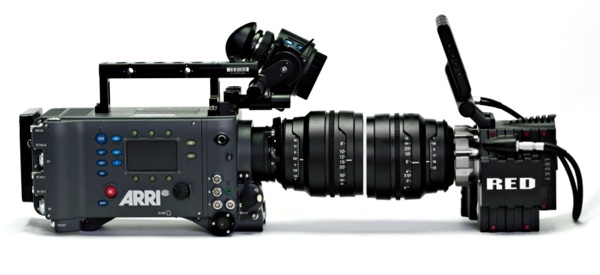
Jim Jannard has posted some test charts shot by RED, comparing ARRI Alexa with the Red Epic MX. Given that Epic is currently in development as a prototype, it’s not a shocker that RED is the first to do any actual chart tests with Epic. The two tests were Dynamic Range and Resolution. On the resolution charts, RED bettered Alexa. That’s not that surprising, given RED’s historical fixation with resolution and that Epic has a 5K sensor. However, I thought that Alexa fared worst in resolution than it probably should have (less than 2K measured), given that it is a 3.5K sensor (though with larger photosites), so perhaps there are some issues there to iron out. I’m sure there will be subsequent tests from others that can confirm or dispute these results, so we’ll see. For today, I’d like to concentrate on the dynamic range charts, which most DP’s are probably more interested in. Read on…
On the dynamic range chart Epic makes a fantastic showing, with what looks like about 13 full stops of usable dynamic range. In this test Alexa appears to be capable of 14 full stops of usable dynamic range. Anything above 13 is amazing, by the way. These are both incredible camera systems! That being said, it’s worth noting that DR chart testing is not always perfect, and not always indicative of real-world conditions. Consider these charts a jumping off place in learning the capabilities of these cameras. Also, reading a Dynamic Range chart is NOT an exact science. Because there is rarely a sudden clip in blacks and the highlights, you have to guesstimate at which point in the highlights or shadows the recorded image becomes unusable…and that is subject to personal bias and your own threshold of what is usable and what is not. Some people don’t mind a little extra noise in the shadows, others demand pristine near-blacks. It’s a very subjective thing interpreting these charts.
Since it’s not an exact science, I’ve decided to mark up these charst with my personal interpretation of the results, how I would count the usable dynamic range on the charts RED shared. Click on the image below for a full-resolution jpg (saved at highest quality). Please note that this is purely opinion, and you should probably come to your own conclusions. Also, these are low resolution jpeg images that Jim has posted on the forum, we do not have access to the raw image data, so this is not an entirely scientific test. Think of it as more of a comparative indicator, assuming all other parameters were equal in RED’s testing and post process. You may also note the vertical streaks on the Epic chart. Jim, Deanon and Graeme of RED have all stated that the vertical streaking on the MX chart is actually a physical imperfection on the surface of the chart, and are not similar to the characteristic vertical streaks sometimes seen in an under-exposed Red One image (such streaks are reportedly also seen when the Red One needs to be black shaded).
As you can see in the image linked below, I’ve added numbers to the original charts that RED posted, tallying up what I consider to be useable stops of dynamic range. I’ve then applied aggressive curves in Photoshop, to eke extra detail out of the highlights and shadows, and marked those stops in a modified chart on the right. This is not necessarily how you would grade your own images, as my curves are harsh and have distorted the greyscale values of the middle portions of the chart. This is not a “pretty” test, these curves are only there to see what detail lingers in the whites and blacks. Note that if you are viewing this on an improperly calibrated monitor your may not be able to see all the detail noted.
In the original Alexa charts, there appear to be 14 usable stops of dynamic range, with perhaps another quarter-stop of range in the shadows. Some might interpret that last shadow stop as usable (it would be marked #15 if I thought it was fully usable). I personally see it as partially usable, as it’s getting pretty dark and noise is beginning to creep in. See how this is so subjective? Also, the top white chip (before #1) appears to be clipped on the original chart (but I was surprised to find later that this is not the case). So in the original chart, I would generously rate Alexa at 14.25 stops DR, and conservatively at 14 stops DR. Either way, Alexa appears to be a touch noisy in the shadows.
In the original Epic chart, there appear to be 13 full stops of usable dynamic range, with what looks like another quarter-stop in the highlights (above chip #1) and slightly less than a quarter-stop in the shadows (what would be chip #14). That last shadow chip is slightly darker than Alexa’s last chip, but it’s clearly cleaner so I give it a full 1/4 stop. Cleaner = more usable in my book. So in the original charts I’d rate Epic generously at 13.5 stops DR, and conservatively at 13 stops DR. Either way, Epic appears to be cleaner in the shadows than Alexa.
After applying some aggressive curves on these charts, some interesting things happen. On the Alexa chart, you can immediately see another full stop become available in the highlights, so I’ve shifted my number scale down to reflect that. You can also see a lot more shadow detail in what would now be the #16 chip, but it’s very chunky and noisy. I hesitate to say that’s a usable stop of shadow detail, so would conservatively rate the Alexa on this chart at 15 full stops, with maybe an additional noisy half-stop available in the shadows. On the Epic tweaked chart, you can see that the top two highlight chips are still mostly clipped. There is some detail in the two chips above #1, but it doesn’t appear to be much additional latitude. I wouldn’t call those noisy highlight chips fully usable. However, there is a bit more information revealed in the shadows on Epic’s tweaked chart. This is the chip that I gave a 1/4 stop in the original chart, with these curves it’s now even more usable and still remains relatively clean (particularly in comparison to Alexa’s shadow detail). So on my curves-abused chart I’d conservatively rate the Epic at 14 stops with maybe an additional noisy 1/4 stop available in the highlights.
As a side note underscoring the subjectivity of these results, I shared my thoughts on this with a Red One MX owner, and his opinion was that the last few shadow stops on the Alexa appeared to be too noisy for his purposes. He actually preferred to match the two cameras closer in measured DR, as he said he would throw away the last two stops of Alexa shadow detail due to chunkiness and noise. Again, these are opinions, so I encourage you to form your own.
What’s interesting to me is how well Alexa handles highlights, and conversely how well Epic handles shadows. Clearly these two companies approached imaging from different perspectives. Epic is incredibly clean in the shadows even when aggressively bumped, while Alexa appears noisy in the shadows even on the original chart. And while RED’s clipped highlights “stayed clipped” for the most part, Alexa recovered a full stop of highlight information without breaking a sweat…it makes me wonder if perhaps they should have exposed the chart even darker to see if Alexa’s highlight handling continues to degrade gracefully even further. Is there an additional noisy 1/4 stop available perhaps? We’re at the top of the chart in this test, so there’s no telling.
Regardless, both cameras are performing exceptionally, particularly considering that neither is in final shipping form. We may well see additional improvements from both ARRI and RED. It’s a very exciting time to be a cinematographer!

