


On one level creating and animating charts and graphs in After Effects is easy, but it can get tricky quick if you go much beyond transformed shapes or the Write-On filter. Here’s a few tools and tutorials that may help get you through and beyond the basics.

On one level creating and animating charts and graphs in After Effects is easy, but it can get tricky quick if you go much beyond transformed shapes or the Write-On filter. Here’s a few tools and tutorials that may help get you through and beyond the basics.
Tools
- AEInfoGraphics by Cihan Balunak is an inexpenive UI script from animated infographic charts from a connected spreadsheet or directly entered data. (video below)
- Michel Pensas posted Easy Pie Chart, a script that helps “create an animated pie chart with values and labels quickly and easily with lots of controls” (video below).
- Momcilo Stojkovic later added Infocharts Creator, an AE script for “creating animated charts with spreadsheet (.csv) data or custom data you can enter directly.” (video below)
- Bars by E-Postprod is an FxFactory plug-in (Mac-only) for Final Cut Pro, Premiere Pro, AE & Motion
- There’s 2D and 3D chart functions in Boris FX and Graffiti (tutorial).
- Ahraon Rabinowitz showed a bar chart made with Trapcode MIR (MIR resource survey).
- Another filter for AE & NLEs is StageTools MovingChart (for Windows).
- From 2006, there’s A line chart script for After Effects by Creative Workflow Hacks.
- Pie Chart, a custom effect preset by Jorrit Schulte, creates pie charts and has a variety of animation and shading options.
- A full-featured native After Effects plug-in, Digital Anarchy Data Animator, became Red Giant Datamator and was discontinued.
- There are now numerous and varied templates available for purchase if you’re in a rush (example 1, 2a, 2b).
- Another emple of an interesting template is After Effects Project Statistician Massive Info Graphics Kit by “AE template Amed99″
- Charts & Graphs for After Effects, a product by Mikey Borup, was released in June 2014 (below). “This is a bundle of 5 custom AE effects that make it super simple to create charts and graphs.”


Tutorials
In Creating 3D Graphs in After Effects, Joe Mason writes about some methods for jazzing up boring data filled video presentations, “giving 2D graphs new life in 3D space. Joe walks through the concept, demonstrating how he quickly cranks out fancy 3D charts.”
Felt Tips posted Building a bar chart controlled by a text layer – After Effects Expression Tip, an 18-minute quicktip showing how to use a text layer in AE to control a simple bar chart. “This could act as the basis for a more complicated set up. The core of the expression is parsing the contents of the text layer as Javascript code, and using a series of indexed layers to respond to changes to the text layer.”
Ted Gournelos covered some basics in Making a 3D Bar Graph in After Effects CS6 , Making a Line Graph With the Stroke Effect, and Making a 3D Pie Chart in After Effects CS6.
Rob Mize posted Graphs and Charts in After Effects, which shows how to use After Effects to create masks and simple expressions to generate and animate Bar Graphs, Line Graphs, Area Graphs and Pie Charts in 3D space. The styles are bare bones but techniques are good. [Part 2 was added later]


“…we will isolate bar elements from a 3D render to build a customizable bar graph in After Effects. We will use expressions to control time-remapping and link values for the displays. The tutorial is a cool 20 minutes for quick viewing and easy reference for when you get the call…”
Andrew Wade modified Andrew Kramer’s techniques to add losses in his video tutorial Dynamic bar charts with After Effects. With positive and negative values.
Harry Frank uses Radial Wipe in Expression Based Pie Charts. See also his 3D bar chart without plug-ins, an AE 6.5 project on AE Freemart. Here’s Making Pie Charts with Expressions by Harry Frank:
Alan Shisko explained how to convert animating vertical bars to a pie chart with Polar Coordinates (Rect to Polar) and enhance it in 3D with Zaxwerks filters in Animating 3d Pie Charts.
In April 2014, Aaron Williams posted a text tutorial, A Simple Trick for Creating Pie Charts in After Effects.
There’s no tutorial needed for this “fair & balanced” pie chart, just eager eyes:


In alternatives to pies, storytellingwithdata (Google’s Cole Nussbaumer) mentions a few ways to tell the same story without the “dreaded” pie charts. There’s more in “An Economist’s Guide to Visualizing Data” by Jon Schwabish (PDF), who was interviewed by VisualLoop on trends in data-vizualization.
A newer tutorial is by Evan Abrams, Easy as Pie Charts – Adobe After Effects tutorial:

Even newer is Creating Dynamic Pie Charts using Expressions in After Effects by OtherCubed. It shows you “how you can create dynamic, easy to change pie charts along with text that changes color and value with your chart, looks at how to apply expressions to some effects, some basic error checking, how to stack layers and how to take values from effects to drive text,” and more.
How to Create a Bar Graph in Adobe After Effects, also by Evan Abrams, uses AE’s grid overlay and ‘snap to grid’ feature to line up Shape Layers and give them simulated 3D depth (no third party plugins required).
Awhile back, Mylenium posted Creating Line Charts with expressions (includes AE 6.5 projects). He has a newer free project too, Column Diagram 2.5D, and some “free lien chart tutorials is still floating around somewhere on CreativeCow.”
Flux VFX posted Single Bar Graph After Effects preset and a tutorial for it:

Mt. Mograph Matt’s Jylkka showed using After Effects and Mocha AE to track a shot to used as a screen replacement, using “bad” footage and sharing useful tips & tricks on Mocha. See Summit 70 – Track. Comp. Win II – After Effects:

Also handy
Flux also has a nice-looking product if you’re in need, Infographics After Effects template.
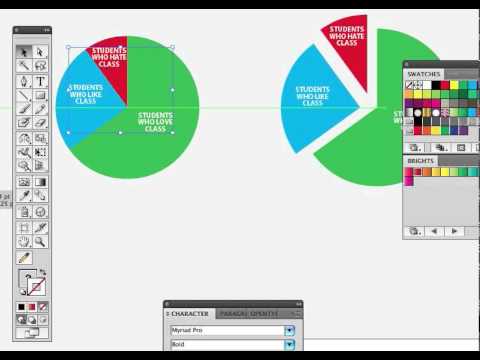
Adobe Illustrator has a comparatively powerful feature in its Graph Tool, so check out 3D PieChart using Adobe Illustrator by Dave Cross at Layers, as well as No More Boring Graphs EVER and Create Beautiful 3D Graphs and Charts in Illustrator. There’s also Apple Keynote and Microsoft Excel, and a ton of other apps and utilities for visualization.
Mike Wirth has nice coverage in Infographic Design 101: Intro to the graph tool in Adobe Illustrator:
Finally, don’t forget background on Understanding Pie Charts, Data Storytelling in Video, Chart Wars and How to Lie with Video Data, and perhaps these:

Note: the carbon use picture is from CarbonVisuals and the Fight Cub LEGO graphs are from Shane Becker. The chart at the top of the page is from Andrew Kramer’s tutorial.